Stop guessing. Start deciding with data.
Every campaign send, every agent reply, every funnel stage — tracked live and surfaced in one dashboard built for WhatsApp-first teams.
10+
Metrics tracked per campaign
Real-time
Dashboard updates
1-click
PDF & CSV exports
How It Works
From raw data to clear decisions
Connect your channels
WhatsApp, campaigns, inbox, and CRM data flow into one analytics layer automatically.
Dashboards populate live
Campaign, funnel, and agent metrics update in real time — no manual imports or exports.
Act on the numbers
Spot bottlenecks, reassign agents, pause weak campaigns — all from a single screen.
What You Measure
Every metric that matters, all in one place
Campaign performance, agent productivity, funnel health, and ROI — tracked live across your entire WhatsApp operation.
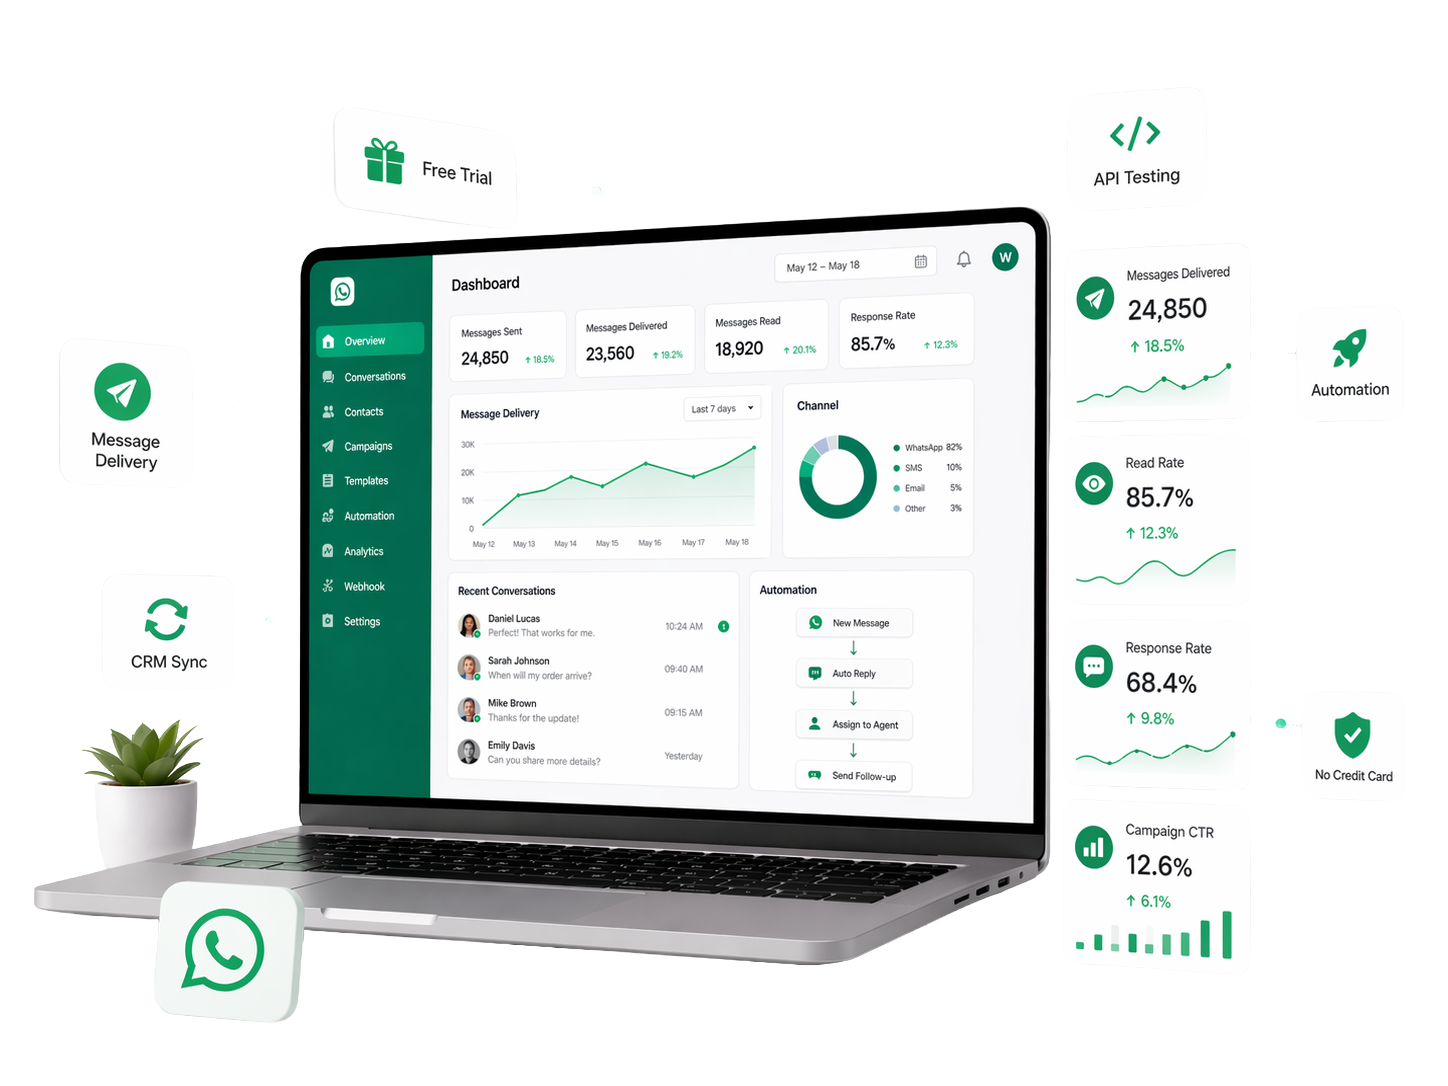
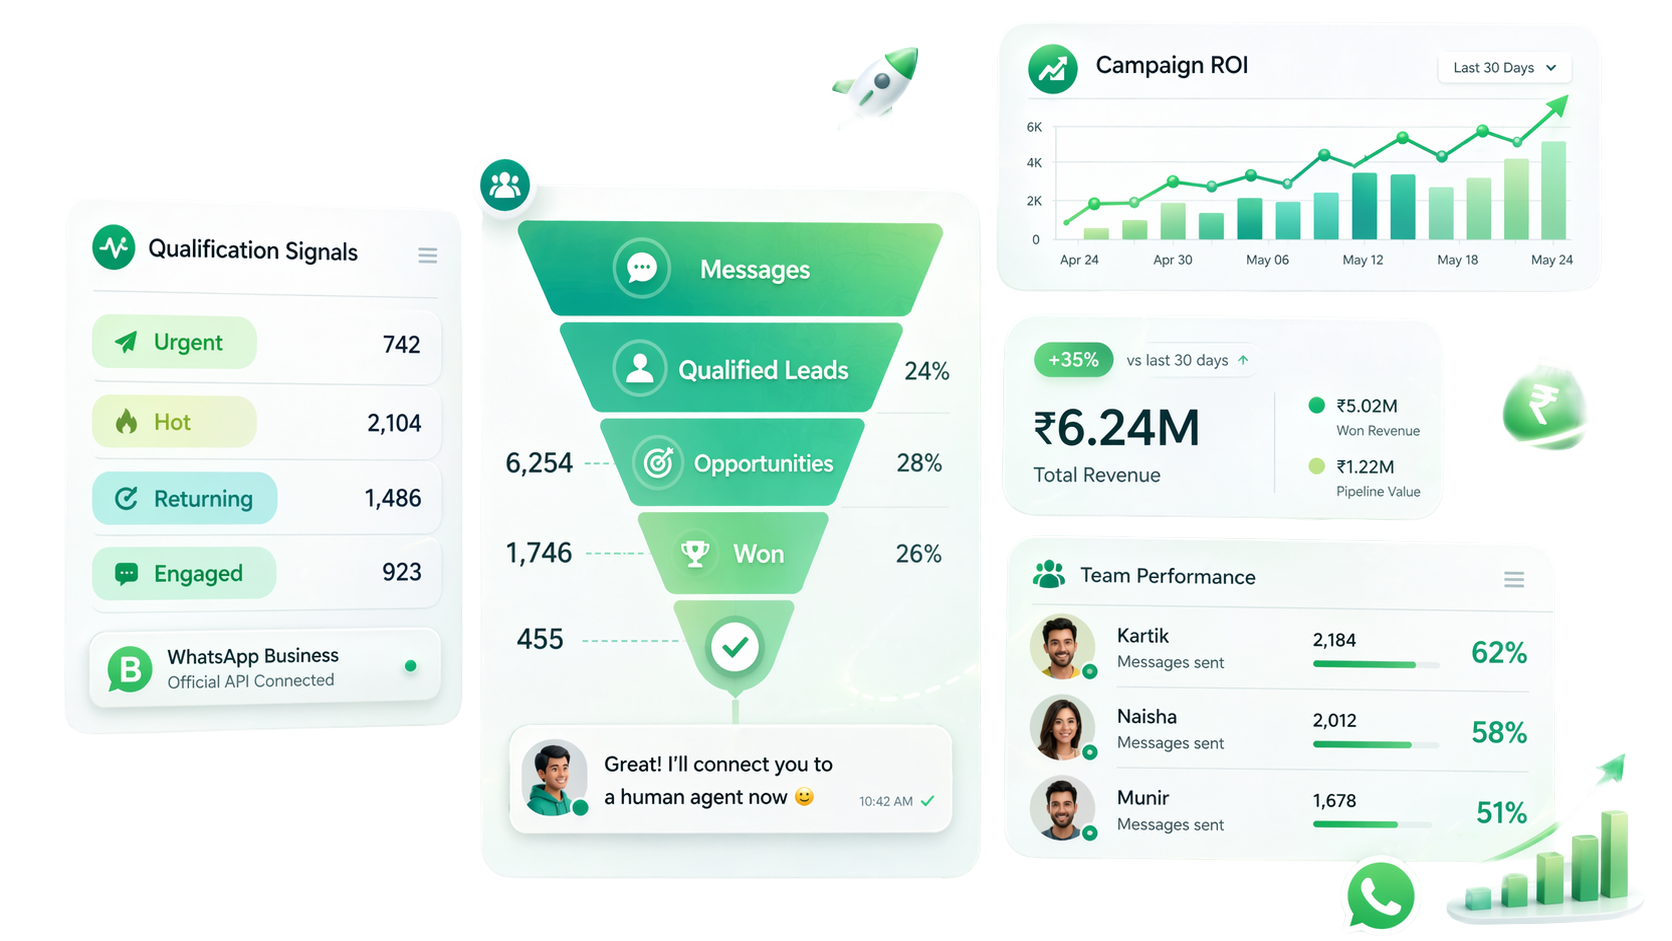
Campaign Analytics
Open rate, click rate, reply rate, and delivery — tracked per broadcast in real time.
Agent Performance
First response time, resolution rate, and CSAT scores per agent — exportable any time.
Funnel Tracking
See exactly where leads move, stall, or drop — from first message to closed deal.
ROI Dashboard
Revenue attributed per campaign, cost per lead, and conversion value — all in one view.
Team Leaderboard
Rank agents by response time, conversations handled, and deals closed this week.
Scheduled Reports
Auto-send daily or weekly PDF reports to managers — no manual exports needed.
Campaign Metrics
Know which campaigns drive revenue
Every broadcast you send is tracked end-to-end — delivery, opens, clicks, replies, and conversions. Compare performance across campaigns and sharpen the next one with hard data.
- Delivery and open rate tracked per message
- Click-through and reply rate per campaign
- Revenue attributed to each broadcast send
Funnel Visibility
See every stage of your pipeline in real time
Move past gut feel. Track how many leads entered this week, how many qualified, how many stalled, and where deals are falling out — before it costs you pipeline.
- Stage-by-stage funnel movement visualised
- Bottlenecks flagged before they become problems
- Conversion rate per stage updated live
Team Performance
Hold every agent accountable — with data
See first response time, resolution rate, and CSAT score per agent. Identify your top performers, coach slower responders, and run a team that's accountable to numbers not opinions.
- Response time and CSAT per agent
- Conversations handled and escalation rate
- Weekly leaderboard exportable to PDF
Get Started
Your team should act on data, not gut feel.
Give every manager and agent a live view of what's working — and the numbers to back every decision.